Matthew Ko, DeepScribe CEO, on DeepScribe AI Pre-charting
DeepScribe CEO Matthew Ko explains how AI pre-charting helps oncologists quickly surface key context to prepare for consults and follow-up visits.

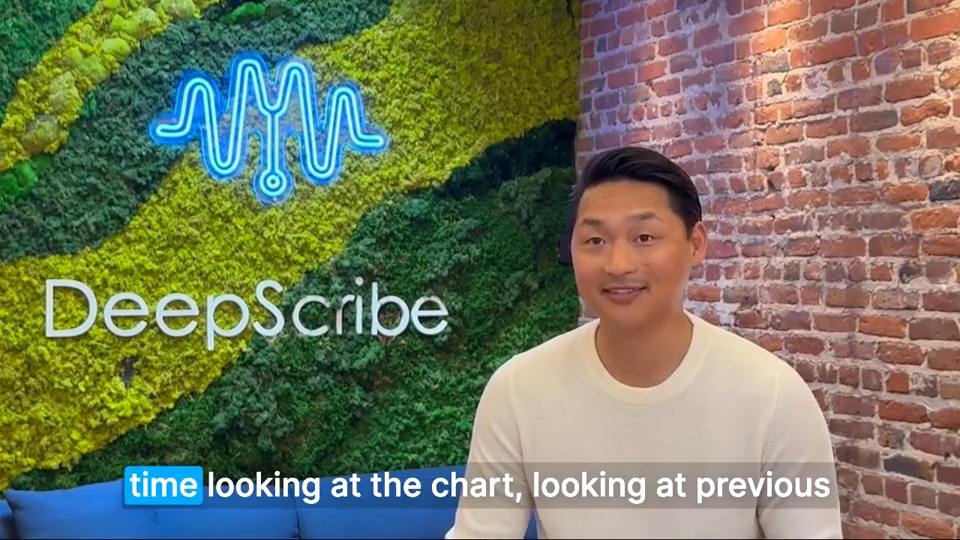
In this interview, DeepScribe CEO Matthew Ko shares how DeepScribe’s AI Pre-Charting feature helps oncologists surface the right context at the right moment.
The feature was shaped through direct clinical observation. By synthesizing data from across structured and unstructured sources — including EHRs, pathology reports, and outside documents — DeepScribe delivers visit-specific summaries based on how oncologists actually work. For new consults, that might mean outlining the full story: diagnosis, staging, and key mutations. For follow-ups, it may focus on recent imaging or changes in labs.
As Matt explains, oncology requires precision and adaptability. DeepScribe’s AI Pre-Charting supports both, helping clinicians walk into every visit more prepared and more present.
Transcript:
Matthew Ko: Clinicians today, before they go in and see the patient, actually have to spend a lot of time looking at the chart, looking at previous visits, looking at pathology reports, looking at labs, images, PDFs, just to get a sense of what they need to do when they enter that room. What DeepScribe's pre charting does is use technology and AI to synthesize all this information across all these various data sources so that the clinicians can spend less time preparing for their visits and make sure that they have exactly the information that they need in order to make the best decisions possible.
We're looking at the conversations with a lot of very different data sources, which include the information from the EHR, but also information from outside of the EHR. We have to go through and find unstructured data and structure it in a way where we can actually make sense of. And by doing this, we're able to have a much wider aperture in terms of the information that we can cultivate. But also we're able to synthesize that information in a way that is pinpoint accurate for our clinicians to be able to deliver the best care possible.
Our approach has always been grounded in clinician feedback, right? We don't just build and ship. We shadow when we observe. We watch how clinicians prepare, where they pause, what they scroll past, what they zero in on.
And over time, you really start to notice patterns. This feature of chart summarization was really born out of one of those moments, you know, during a routine on-site, just following a clinician through their day, and that's when it really just clicked. The real need wasn't just summarizing charts. It's really also servicing the right context based on the visit, based off the patient and the way each oncologist works.
For a new consult, for example, that might mean the full story arc. Right? The diagnosis, the staging, the key mutations. And for a follow-up, it might be just the progression since the last visit.
You know, the imaging, the labs, and even then, it's fluid, right? The relevance of that information shifts depending on where the patient is on their journey and what the clinician needs in that moment.
text
Related Stories
.png)

Realize the full potential of Healthcare AI with DeepScribe
Explore how DeepScribe’s customizable ambient AI platform can help you save time, improve patient care, and maximize revenue.